Chapter 2: The impact of the sea
2.2 Waves (2)
![]()
| European Coasts - An Introductory Survey Chapter 2: The impact of the sea 2.2 Waves (2) |
|
| Sea area | Hs range | chance of occurrence | 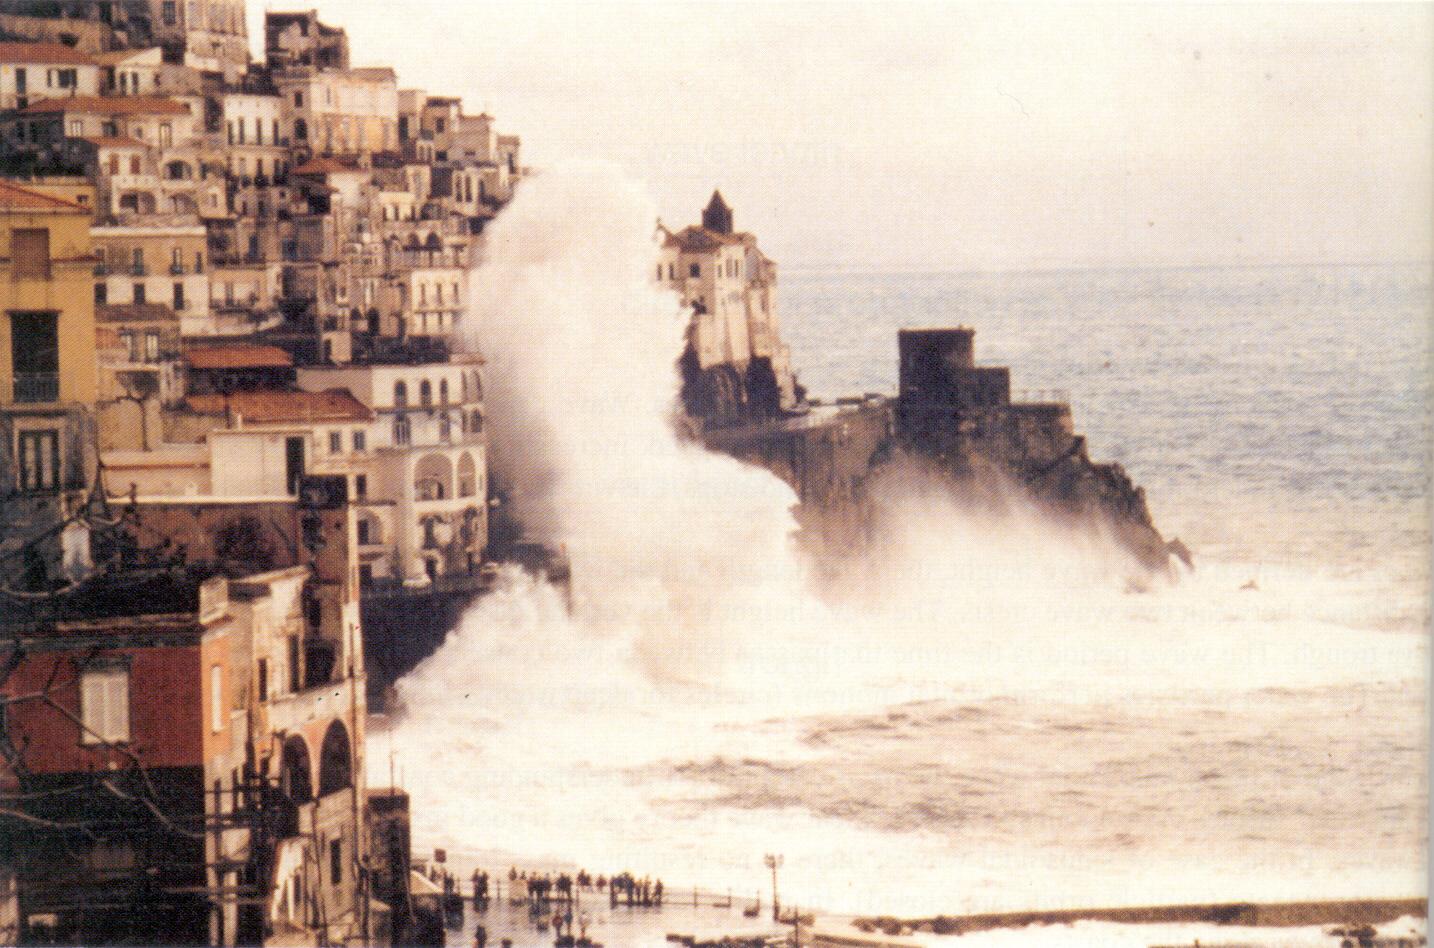 |
 |
| Baltic North Sea Irish Sea Atlantic Ocean, west of Ireland Gulf of Biscay Atlantic Ocean, west of Spain Medeterranean W Medeterranean E |
2-3 m 5-6m 2-3 m 9-10 m 2-3 m 9-10 m 3-4 m 11-12 m 3-4 m 10-11 m 3-4 m 11-12 m 2-3 m 7-8 m 2-3 m 7-8 m |
185/1000 |
||
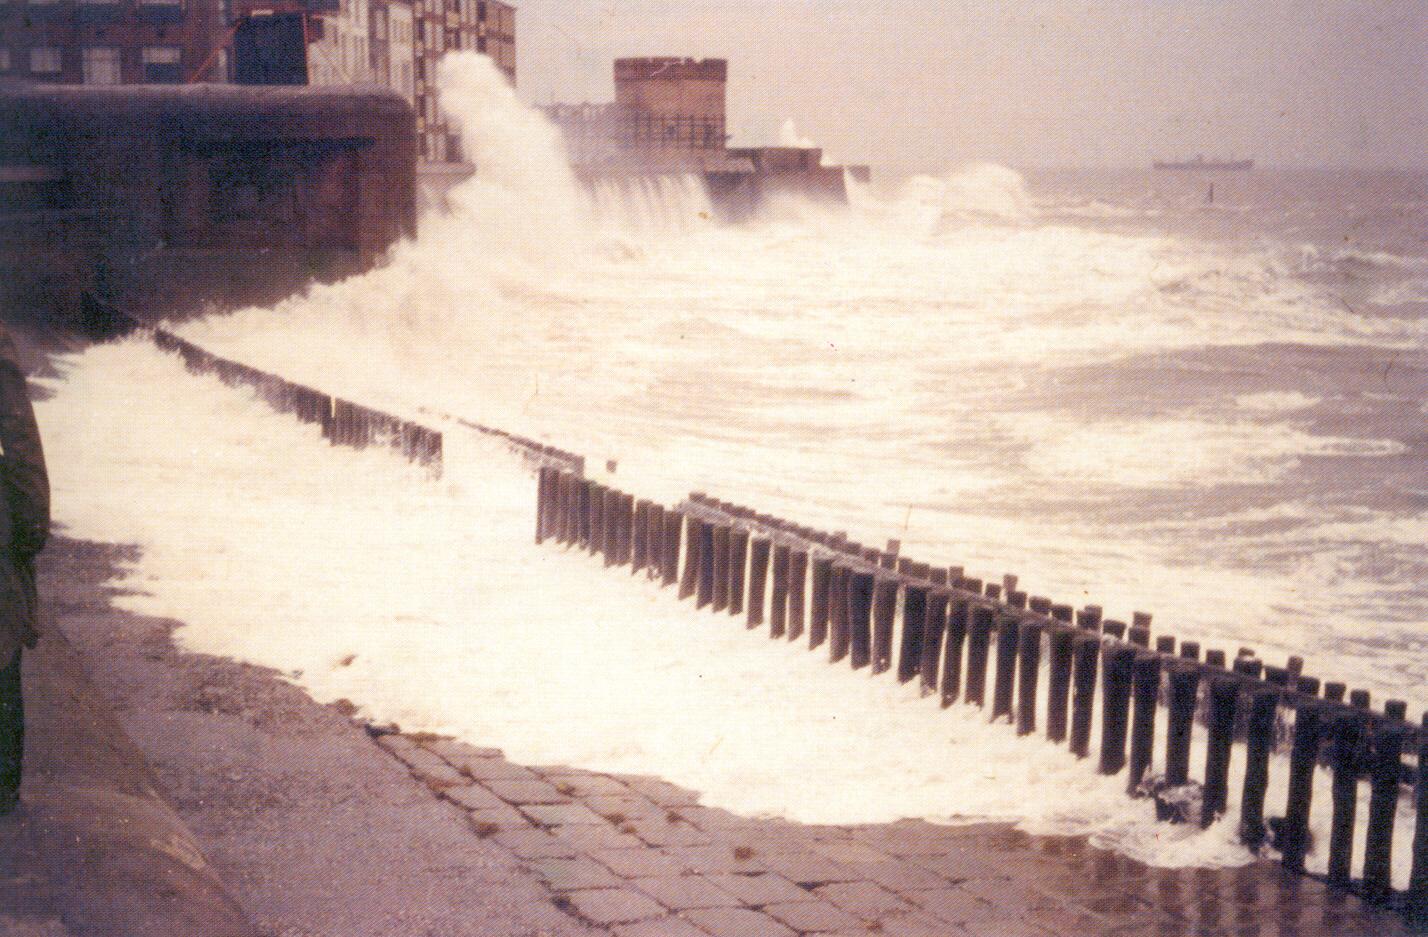
| Table 2: Significant wave heights at different locations in Europe. Both a common wave height range and an extreme wave height range have been given (From Global Wave Statistics, 1986) | Fig 40: High wave attack and wave run-up on a rocky coast 911/1/87, Amalfi, Italy) | Fig 41: Wave attack on the Boulevard at Vlissingen (Flushing, the Netherlands) | ||
Irregular waves
Though a useful instrument to describe the physics of water waves, the sinusoidal wave theory does not account for the irregularity of the real sea surface. This irregularity is described with statistics: stochastic
variables represent the water surface. Stochastic wave descriptions play an important role in coastal
engineering.
The most common stochastic variable used in coastal engineering is Hs, the significant wave height. It is the mean height of the highest 1/3 of the waves. One single value of Hs represents the measured wave heights in an area during several hours of similar weather conditions. It characterises short term conditions and may be used to estimate the short term distribution of individual wave heights. A theoretical distribution which often adequately gives the short term distribution of the wave heights is the Rayleigh distribution (see Fig. 39).
Apart from this short term distribution of the wave heights, a second statistical instrument is needed which describes the long term distribution of the waves. It gives the probability of a sea state characterized by a single Hs value. Examples of observed long term occurrences are given in Table 2.
The large impact of storm waves on the coastal area is illustrated in Fig. 40 and Fig. 41.
previous page table of contents next page
| This page is from the book "European Coasts", produced in the framework of the Erasmus project under EC contract ICP 92-G-2013 and placed on the Internet in the framework of the PIANC-MarCom initiative on Education. |